

7 ways to map hidden bottlenecks in your operation

Hidden bottlenecks are steps that consume time and energy without appearing in any report. To find them, combine seven approaches: direct observation, process mapping, queue analysis, listening at both edges of the flow, a spreadsheet audit, continuous digital monitoring, and small tested changes. Each one exposes a different kind of block.
Why are hidden bottlenecks so hard to see?
Obvious bottlenecks find themselves: a system outage, an order stuck for a week. The expensive ones are camouflaged. An approval waiting two days in an inbox. Rework that became routine and stopped being questioned.
Nobody flags these blocks because, taken alone, each step looks reasonable. The problem is the sum. Asana's Anatomy of Work research estimates that 60% of work time goes to "work about work": alignment meetings, hunting for information, switching tools and chasing status. People inside the process get used to it, and the waste becomes scenery.
That is why finding bottlenecks takes method. Good intentions walk straight past what is camouflaged. The seven methods below complement each other, ordered from the simplest to the most structured.
1. Direct observation of the workflow
Sit beside the team and watch the work happen at its real pace, without interfering. Note every step, every wait, every task that goes backward. This simple exercise usually exposes three patterns.
- Important tasks lost among unnecessary checks.
- Islands of knowledge: activities only one or two people can perform.
- Requests that bounce back because acceptance criteria are unclear.
The third pattern is more common than it looks. Atlassian's State of Teams 2025, which surveyed 12,000 knowledge workers and 200 executives, found leaders and teams wasting 25% of their time just searching for answers. No report substitutes for watching how people actually work.
2. End-to-end process mapping
Plenty of companies have tried to map processes and quit halfway. The reason is usually the same: the map came out too generic to be useful. The value sits in the detail. Which task depends on which, who answers for each activity, which approvals are genuinely necessary.
A collaborative flowchart, drawn with the people who do the work, exposes excessive waiting points, steps created for problems that no longer exist, and tasks still manual out of pure habit. On that last group, one caution: not every manual step is a defect. Some of them absorb exceptions that automation handles badly, and telling the two apart is its own decision.

3. Quantitative analysis: where there is a queue, there is delay
Your ERP, CRM and even the operation's spreadsheets hold clues nobody reads. Average time per step and idle time between steps already tell most of the story. Putting those numbers on a simple dashboard changes the team's conversation from "I think it takes a while" to "it is measured".
The practical rule is to look for queues. Wherever work piles up waiting for someone, a bottleneck exists, visible or not. And if the queue always grows at the same point, suspect the design of the process before blaming the person standing in it.
4. Listening at both edges of the flow
The people who receive the demand at the start and deliver the result at the end see problems that are invisible to the middle of the chain and to management. Reviews done twice, end-of-line adjustments that cancel the effort made at the beginning, information arriving incomplete. These findings rarely reach a board meeting.
Two questions open the conversation: "what makes you wait?" and "what do you redo often?". The answers are usually worth more than weeks of analysis.
5. Auditing how spreadsheets are used
Dozens of interlinked spreadsheets are a classic sign of a bottleneck forming. Each one was born to solve a specific problem and made sense at the time. Together they form a web nobody sees whole.
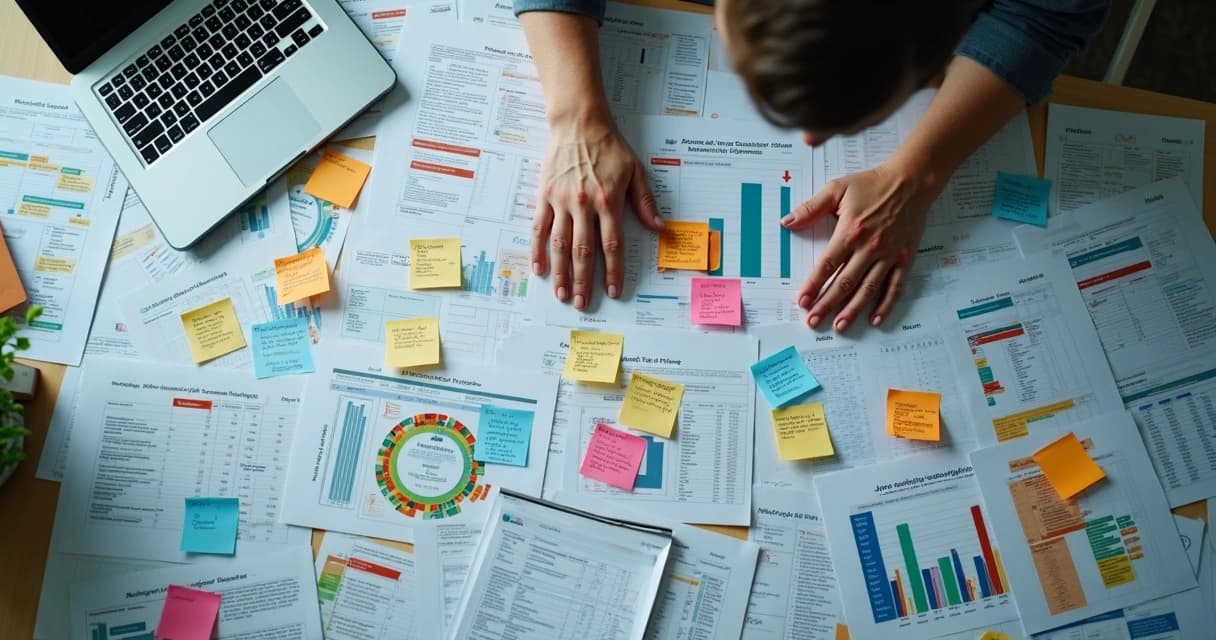
The warning signs: a spreadsheet that depends on another spreadsheet, a version circulating by email, data typed twice in different places. At those points information moves slowly and errors multiply. List where this happens in your operation and you have half a bottleneck map already. If the list turns out long, the question shifts to when to replace spreadsheets with custom software.
6. Continuous digital monitoring
Automations and system logs measure the duration of each activity without depending on anyone's perception. Cross that data and you can spot waiting peaks and anticipate where the next bottleneck will form, before it shows up in the month's numbers.
Your systems' audit logs are the cheapest starting point, since they already record who did what and when. The advantage over manual mapping is permanence: monitoring keeps working after the diagnostic ends.
7. Testing hypotheses with small changes
Mapped a suspicion? Run a cheap test before investing heavily. Swap the order of two steps, or move a recurring approval to a different owner. Document the before and the after.
Picture a distributor where every purchase order waits for the director's signature, including the small ones. A two week test with delegated authority for smaller orders shows, in numbers, what the old rule was costing. If the gain appears, the change sustains itself. If it does not, the experiment cost almost nothing.
That is the point of testing small. The alternative, redesigning a process on conviction alone, costs more and teaches less.
How do you turn mapping into a routine?
Mapping once helps. Keeping bottlenecks visible is what sustains the gain. The seven methods reinforce each other: the numbers point at where to look, and observation and listening explain what the numbers leave out. Two practices hold the result over time: revisit the map each quarter, and give every indicator an owner.
When the bottlenecks point at the structure, with systems that do not talk and data scattered across tools, the next move is redesigning the base. That path is in internal systems architecture: 8 steps against bottlenecks. It is a pattern we meet often in diagnostics: behind an apparent technology problem there is almost always a process design nobody has revisited.
Frequently asked questions
Do I need a consultant to map hidden bottlenecks?
Not to start. Direct observation, listening at the edges and a spreadsheet audit can all be done internally within a few weeks, with no new tooling. Outside help earns its cost when the operation has grown beyond what the team can see whole, or when the necessary changes run into disputes between departments.
How long until the first bottlenecks appear?
The first ones show quickly. A week of direct observation and an afternoon of conversation with both edges of the flow usually produce an initial list of suspects. Full mapping, with data and continuous monitoring, is one to three months of work depending on the size of the operation.
Will the team feel watched during the mapping?
That depends on how the work is introduced. The object of analysis is the design of the process, not anyone's individual performance. Explain the goal before starting, share the findings with the people who took part, and prioritize fixes that remove repetitive work from their day. The first queue you eliminate convinces people better than any speech.
Next step
If your operation is showing signs of a bottleneck, with deadlines slipping and information moving from spreadsheet to spreadsheet, methods 1, 4 and 5 cost nothing but attention and you can apply them this week. To shorten the path, an Operational Architecture Diagnostic is a 30 minute conversation to locate the points of highest friction and leave with a clear direction on what to attack first. Book the diagnostic.
Read next
Related case studies

Did you recognize your operation in this article?
Book the Operational Architecture Diagnostic: 30 minutes to map where your operation's bottleneck is. No proposal in the first conversation.
Book a diagnostic